


You can't solve problems you don't know you have. So, where do you get the data needed to improve your inventory strategy?
Monitoring the right key performance indicators (KPIs) is essential for boosting your business's agility and efficiency in inventory management, profitability and customer experience.
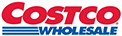
What Are KPIs in Inventory Management?
In inventory management, KPIs are metrics you can use to better understand your company's logistics and supply chain operations. They allow you to track your performance over any given period, so you can identify problems that may not have been apparent before.
Using an integrated inventory management software system simplifies KPI tracking by creating a single source of truth for all your organization's inventory-related data.
Benefits of Tracking Inventory KPIs
Tracking and analyzing inventory KPIs unlocks the power of data-driven decision-making in supply chain and logistics, which can:
- Enhance your reputation: Data-driven decision-making can help you identify solutions for common customer pain points like stockouts and delayed shipments, improving the customer experience and boosting your standing as a reliable business.
- Improve operational efficiency: Regularly monitoring KPIs can uncover hidden obstacles in key areas of your business, such as inefficient warehouse layout, so you can resolve them.
- Reduce costs: Analyzing your metrics can reveal previously hidden losses and waste within your logistics and supply chain, helping you find cost-saving solutions.
- Better align operations: KPIs can reveal areas where your operations do not clearly align with your business's mission statement, which gives you the insight needed to bring everything back on the same page.
- Increase sales: Tracking metrics like backorder rate and sell-through rate can help you identify ways to better stock products so you can get more items out the door.
- Improve cash flow: Improving your stocking and order fulfillment strategies enables you to convert more products into cash, which is critical for boosting revenue.
- Eliminate supply chain bottlenecks: Your insights can help you identify which areas of your supply chain are working as needed and which ones are not — which could require you to switch suppliers for better results.
9 Examples of Important Inventory KPIs
Key Performance Indicators (KPIs) are critical for helping you meet specific operational goals, such as accelerating order fulfillment or minimizing stockouts. Below are nine valuable inventory metrics, along with brief descriptions, that you can track for your retail business:
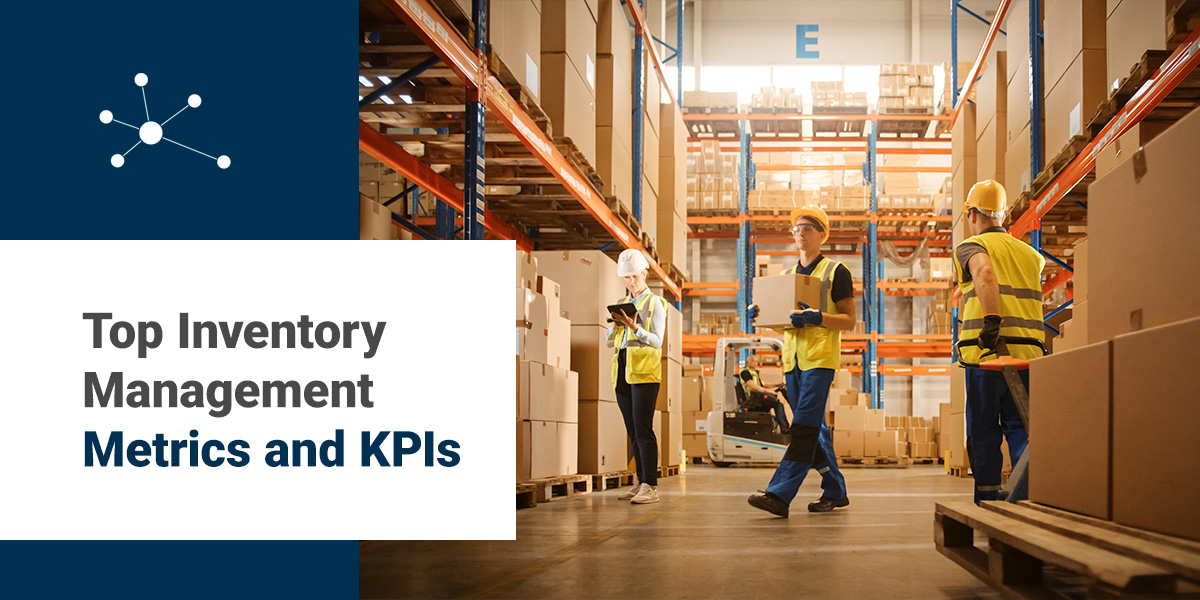
1. Gross Margin Return on Investment (GMROI)
Sometimes called the gross margin return on inventory investment (GMROII), this inventory management KPI analyzes how quickly your company recovers the cost of inventory purchases. In other words, it measures your ability to turn purchased inventory into profit.
To calculate your GMROI, divide your gross margin by your average inventory cost for the period. You'll want to aim for a high number here, as the greater your GMROI, the better your profit margins.
2. Backorder Rate
Tracking the percentage of orders your company is unable to fulfill by the original date reveals valuable insights about your ability to adequately stock fast-moving products.
Here's why that's important. When your products are on backorder, you incur additional costs:
- Lost revenue: Unless you offer preorders, you can't make any sales on backordered items until your next restock.
- Partial shipping: Shipping partial orders can help keep your customers satisfied until the backordered product is back in stock, but it incurs additional costs in picking, packing and shipping the rest of the order.
- Returns: Backorders frequently have a higher return rate than regular orders, which can drain your revenue potential.
- Customer churn: Today's customers expect rapid order fulfillment and real-time updates. Because backorders make it near impossible to deliver on those expectations, customers are less likely to give your brand a second chance in the future.
If your company uses other e-commerce channels, like Amazon or Walmart, a high backorder rate could also cause you to lose access to those channels.
To calculate your backorder rate, divide the number of backorders by the total number of orders for a given period and multiply that result by 100. The lower the percentage, the better your performance.
3. Sell-Through Rate (STR)
STR is a great KPI for monitoring supply chain efficiency over any given period. This period can be monthly, quarterly or yearly depending on the scope of your analysis.
Your STR compares the amount of inventory you sell to the amount you receive from the manufacturer to reveal how quickly you can clear inventory and turn it into profit. This metric is a good measure for understanding cash flow and forecasting demand for specific products.
To calculate STR, follow this formula:
- Divide the number of units sold by the number of units received.
- Multiply the result by 100 to get your final answer.
A high STR indicates a fast-moving product that could be at risk for stockouts, while a low STR indicates a slow-moving product that could turn into dead stock if handled improperly.
4. Inventory Turnover Rate
Your inventory turnover rate measures how efficiently your company sells out of and restocks a specific product over a designated period.
You can also calculate days on hand (DOH) or weeks on hand (WOH) for more targeted insight into how long it takes to clear each product from your warehouse.
Follow these simple steps to calculate your inventory turnover rate:
- Divide the cost of goods sold (COGS) by the number of days it was in your warehouse.
- Divide the average inventory number by your result from the previous step.
Ideally, your final result should be a low number — the lower your inventory turnover rate, the faster you typically convert your inventory to cash.
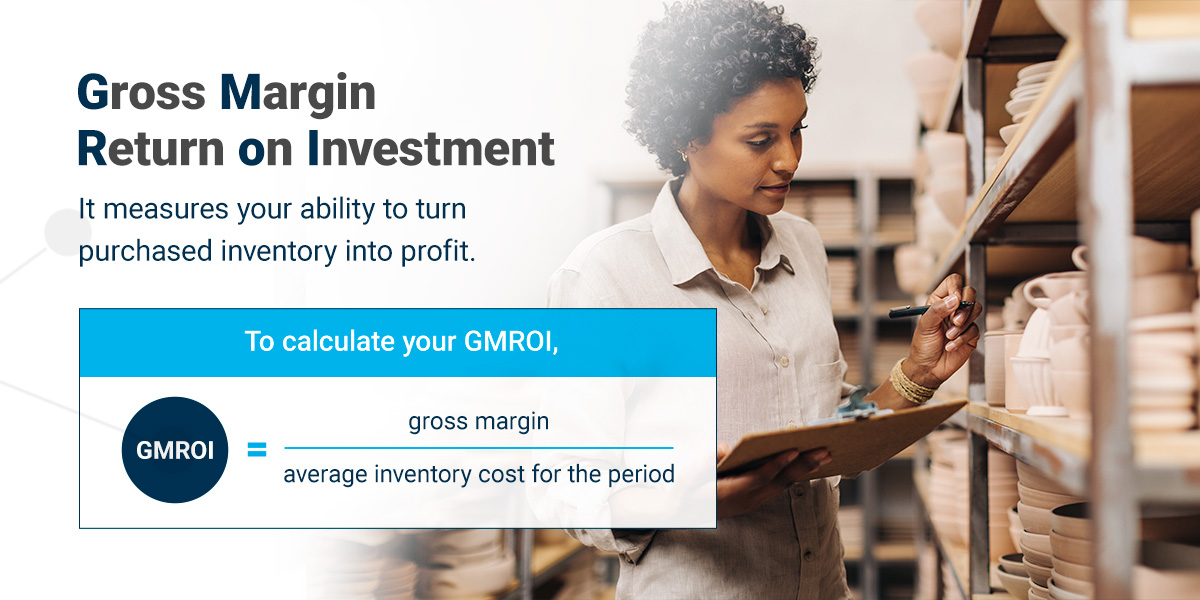
5. Perfect Order Rate
This metric tracks the percentage of on-time orders your company ships without any deviations or errors, which is critical for maintaining high customer satisfaction.
Follow this formula to calculate your perfect order rate:
- Multiply the percentage of orders delivered on time by the percentage of completed orders.
- Multiply the above number by the percentage of orders without damage.
- Multiply that result by the percentage of orders that were documented accurately.
- Multiply this number by 100.
The higher your final result, the better your perfect order rate — you want to get as close to 100% as possible.
Combining your perfect order rate with another metric, like backorder rate or customer satisfaction score (CSAT), can help you pinpoint key areas for improvement. Some examples include:
- Streamlining the ordering process to reduce the risk of sending the wrong product.
- Regularly inspecting your stock to get rid of damaged products.
- Choosing new packaging to protect products from damage while en route.
- Switching shipping carriers to improve on-time delivery rates.
6. Shrinkage Rate
In 2022, more than 13% of United States-based retailers experienced inventory shrinkage of at least 3%. This inventory loss is important to track because it reveals how much product you can't sell due to external causes like:
- Theft
- Accidental damage
- Human error
While many of these issues are purely accidental, you can prevent some of them. For example, if you know the area near your warehouse has a higher crime rate, you can invest in more advanced security systems to reduce your risk of theft.
To calculate your average shrinkage rate, follow these steps:
- Determine the value of your unexplained losses.
- Divide that number by the total sales value.
- Multiply your result by 100.
A lower number is a good sign, as it indicates the majority of your inventory is sellable. The higher your number, the less you can sell and the lower your return on investment.
7. Lost Sales Ratio
When you run out of stock, you lose sales. Your lost sales ratio measures how many sales you're losing in a given period by comparing the number of days a specific product is out of stock to the demand forecast.
It's a helpful KPI for inventory management, especially when combined with sell-through rate or days on hand because it can reveal whether you're accurately forecasting demand for specific products.
Divide the number of days your product was out of stock by 365, then multiply your result by 100. The lower the number, the better.
8. Inventory Carrying Cost
Also known as holding costs, your inventory carrying cost is how much your company pays to store a specific product.
Your total holding cost includes the following components:
- Warehousing
- Rent
- Labor
- Insurance
- Damaged or otherwise unsellable product
The formula is more complex than many of the others on this list, so here's a quick breakdown:
- Add your inventory service costs to the costs of storage, capital and risk.
- Divide the sum by the total value of your inventory.
- Multiply the result by 100.
A smaller number indicates that you can keep holding costs fairly low, while a higher number is a clear sign of inefficient cost management.
9. Customer Satisfaction Score (CSAT)
This metric provides valuable insight into how customers feel about ordering from your company — which is essential for boosting customer loyalty, attracting new customers and improving revenue generation.
That said, tracking this metric can be tricky without customer feedback. Asking customers to fill out a short survey after order fulfillment is one of the most effective ways to source this feedback, though you can also pull data from online reviews and rating sites.

Because manually sorting through all that data can be time-consuming, we recommend using automated tech tools that can do it for you. Sentiment analysis, an artificial intelligence (AI) technique that analyzes written content to determine the author's emotion, is a great example.
Calculating the score is simple once you have all the information you need:
- Divide the number of positive responses by the total responses.
- Multiply your result by 100.
The higher your result, the more satisfied your customers are on average.
Monitoring this score over time can help you identify solutions for common customer pain points, such as:
- Enabling customers to track their orders with integrated tools.
- Improving personalization at key touchpoints.
- Adopting an omnichannel approach to communication.
How to Choose the Right Inventory Management KPIs for Your Business
First, remember that you can only monitor a few KPIs at once. You need enough data to get the full picture, but tracking too many metrics simultaneously can unnecessarily complicate matters.
Here's a quick step-by-step guide to choosing metrics for inventory management:
- Set goals: Assess your company's overall performance and target several areas of improvement that align with your mission.
- Prioritize: Identify which of your goals are the most important to your company's immediate progress. Establish a limit of five goals to ensure you have the resources and time to give each goal the proper focus — remember, you can always change your goals in the future as your needs evolve.
- Choose KPIs for each goal: Once you've prioritized your goals, assign one to three KPIs to each goal.
- Assign roles and responsibilities: Make sure each KPI has an owner who is responsible for monitoring and reporting on progress. This step helps promote accountability and ensures your team stays focused on their assignments.
If needed, you can also create custom KPIs to meet goals that may not clearly connect to common metrics. Leveraging integration solutions can help you design these KPIs and ensure they fit into your overall data ecosystem.
The Importance of SMART Goals in Choosing KPIs
While you might be familiar with the concept of SMART goals, it's important to reinforce their value in making real business improvements.
We'll go through each letter of the acronym to demonstrate how setting SMART goals can help you choose the metrics that will propel you to a better inventory management strategy:
- Specific: Having a clear goal allows you to closely align your KPIs to your desired business outcomes, which is essential for generating the insights you want.
- Measurable: Progress is easier to track with hard numbers than by analyzing opinions. While qualitative feedback can provide useful context for customer experiences, you should choose KPIs that will provide quantitative measurements.
- Achievable: Be ambitious but realistic in your goals to ensure you can reach them.
- Relevant: Your goals should matter to your organization. Does this goal make sense for your business, and does the KPI you've chosen clearly connect to the goal?
- Time-bound: Limiting your progress to a specific period helps narrow your focus and improve your chances of achieving your goals. For example, you could choose to measure your CSAT scores over the course of several years to see whether you've adequately addressed customer complaints.
Contact ConnectPointz for Inventory Management Integrations
Consistently tracking inventory management metrics over time is essential for making more informed logistics decisions, improving customer relations, cutting unnecessary expenses and much more. However, relying on disparate manual processes or legacy software — or both — makes it difficult to generate the insights you need quickly.
ConnectPointz uses automation to connect all your tech tools, allowing them to transfer data seamlessly across your organization for easier, more accurate data analytics. Depending on your needs, our team can either help you implement a preconfigured system or design a custom solution tailored to your company's requirements.
Learn more about how integrated solutions from ConnectPointz can help your organization improve its inventory management strategy. Contact us today to discuss your needs and get your free quote.